Hardware: All Round Performance
By MYBRANDBOOK

Defying the speculation that GST and demonetization would adversely affect, the Indian hardware industry demonstrated a splendid growth across segments
The industry was apprehensive about the 2017 owing to speculations that implementation of GST, demonetization and a call for industrial digitalization would slow down the sales of hardware products. However, the result was the exact opposite and the reasons are the exact same. While digitalization calls for more software than hardware, industry bought more servers and PCs during the year. When GST was believed to impact the sales of hardware products, a drop in tax slab for printers spiked the sales in the last quarter of the year, and then the server market also registered record sales as enterprises looked towards cloud and outsourced solutions as their next business strategy.
All in all, these three primary hardware segments brought a momentous year for the Indian hardware industry.
Server market in India
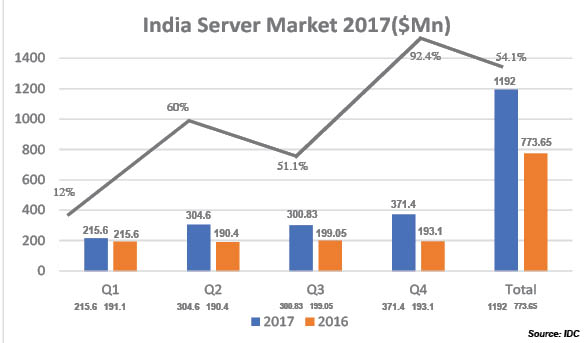
Servers are the key component of enterprise computing infrastructure. If we look at the last few years, the market was impacted by recessionary trends. Only last year, the market began to pick up because of the trends such as digital and cloud. As we take an audit of the year went by, the x86 servers saw aggressive growth. The overall server market in India witnessed a year-over-year (YOY) increase of 92.4% in terms of revenue to reach $371.4 million in Q4 2017 versus $193.1 million in Q4 2016, according to the latest IDC Asia-Pacific excluding Japan (APEJ) Quarterly Server Tracker, Q4 2017. The x86 server market accounted for 86.7% of the overall server revenue during Q4 2017, with growth being majorly driven by spending from professional services, government, telcos, and banks.
 The Q4 2017 quarter has been record-breaking for both non-x86 and x86 server product categories. Non-x86 platform remains at the top of mind for many end-users looking for data workloads such as databases, data warehouses, transaction processing, and high-performance computing. Banks are the primary buyers in this category and high availability with minimum downtime, maximum uptime are key considerations.
The non-x86 server market grew by 115.6% YOY in terms of revenue to reach $49.6 million in Q4 2017. In terms of revenue, IBM leads the market, accounting for 47.8% of market share, followed closely by HPE with its share of 44.7% during Q4 2017. In the non-x86 server market, the banking industry continues to dominate and accounts for 55.9% of the revenue, followed by government with 21.1% and manufacturing with 7.4%.
The x86 server market in terms of revenue witnessed a YOY growth of 89.3% to reach $321.9 million in Q4 2017, up from $170.1 million during Q4 2016. The growth was majorly driven by professional services, government, banking and telecommunications, while manufacturing continues to witness growth for the straight third quarter. Blade and rack optimized servers together accounted for 75.1% of the overall x86 server market by revenues during Q4 2017. In the x86 product category, 99.7% were Intel-based processors sold in the volume, mid-range and small server segment.
In the Indian x86 market, HPE leads the Indian server market with 32.8% in Q4 2017. The major deals for HPE came from telecommunications and professional services verticals. Dell successfully increased its market share to 19.4% during Q4 2017, while Cisco accounted for 6.6% of market share winning deals across different verticals. Cray successfully closed the deal with Central Government on supercomputer project and grabbed the market share of 9.3%, whereas ODM direct market share declined to 21.2% in Q4 2017.
“Traditional three tier architectures are still at the mainstream of India enterprise infra market. We have seen professional services, and telcos as early adopters and innovators towards adoption of virtualization and using HCI approach for their DC strategy. New-age workloads such as IoT, big data analytics, and AI are still at a nascent stage and requires significant efforts from vendors and OEM ecosystem towards educating the end-users and its business outcomes,” says Harshal Udatewar, Server Market Analyst, IDC India.
PC market in India
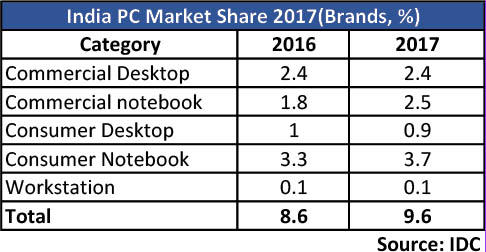
The overall India’s traditional PC shipments for 2017 stood at 9.56 million units, with an 11.4% year-on-year growth, as per IDC. This growth was primarily driven by the increase in the quantum of large projects and surge in shipments post the introduction of GST reforms.
 The PC market in the first half of the year declined by 5.2% compared to H1 2016, owing to sluggish consumer demand due to demonetization and uncertainty surrounding GST implementation. However, early kick-start of festival offers by e-trailers, incremental consumer spillover demand post GST implementation and large state-owned special projects drove the PC market in the second half of the year.
The overall consumer PC market registered 48.0% shipment share in 2017, the consumer category also recorded a growth of 8.5% in unit shipments compared to last year. “Consumers were somewhat hesitant during the GST implementation phase in H1 2017. However, upbeat demand towards discretionary spending on the back of seasonality and re-building of inventories post festive season drove growth in H2 2017,” says Manish Yadav, Associate Research Manager, Client Devices, IDC India.
The overall commercial PC market recorded 52.0% shipment share in CY2017, where the category grew by 14.1% in unit terms year-on-year. “Commercial spending seems to be leaving the GST-related glitches behind with increased demand across segments like SMB and enterprise,” adds Yadav.
HP maintained its leadership position in the overall Indian traditional PC market with 29.9% share in CY 2017 and recorded an overall growth of 17.4% year-on-year in CY 2017. The vendor remained dominant in the overall consumer PC business with 29.2% share and an 18.0% year-on-year growth in CY 2017 owing to its growing brand image and depth penetration via its growing partner base. The vendor also led the commercial segment in the last two years by clinching volumes in special projects such as ELCOT and strong presence in enterprise accounts, which assisted HP Inc. in recording a 30.6% market share along with a growth of 16.9% year-on-year in CY 2017.
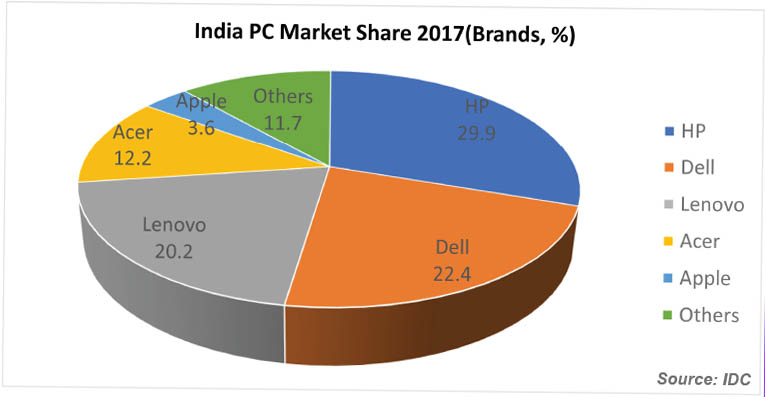 Dell took the second spot, with a 22.4% share in the overall India traditional PC market in CY 2017. The vendor got impacted by GST and BIS certification in CY 2017. However, with increased shipment and differentiated channel programs, the vendor bounced back with 7.3% growth year-on-year in overall traditional PC market in CY 2017. Dell continues to dominate the growing categories like gaming notebook with 26.8% year-on-year growth. The vendor also recorded 22.1% shipment share in CY 2017 in overall commercial PC business with increasing investments in channel, supported by both distribution and partner-led GTMs. Also, its growth in verticals like BFSI and government in H2 2017 is a welcome sign of increasing customer base for the vendor.
Lenovo holds on to third spot, gaining 2.6 percentage points year-on-year to record a market share of 20.2% in CY 2017 in the overall Indian traditional PC market. In the overall consumer category, the vendor recorded 16.7% market share in CY 2017 on the back of growing online presence, innovative products and new efforts on providing improved after- sales service via new channels, made the vendor stand out from their competitors. Additionally, with the execution of state-owned manifesto projects, gradually bringing back the confidence in enterprise accounts by offering bundle services along with new products, assisted the vendor in a strong growth of 40.1% year-on-year with a market share of 23.4% in the overall traditional commercial PC market in CY 2017.
India External Storage Market
India’s external storage market reached $280 million by end of March 2017 telecommunications and banking being the major growth verticals.
Multimillion-dollar deal in telecommunication vertical drove this growth in the external storage market. Banking, telecom, professional services, manufacturing and government continued to be the key contributors in Q1 2017. In addition to the major verticals, significant growth is witnessed in verticals such as Securities, Transportation and Insurance during this period. This led to India’s external storage market witness a growth of 13.8 percent year on year(YoY) and stood at $ 74.6 million in Q1 2017.
 High-end storage segment witnessed a strong YoY growth in Q1 2017 due to large deployments from telecommunications, banking and government verticals. Entry-level storage saw a marginal growth while mid-range external storage saw a marginal YoY decline in market share during Q1 2017.
Witnessed significant uptake of All flash Arrays (AFA) among telecom, BFSI, IT/ITeS, government and manufacturing units in Q1 2017.Acceptance of AFA is increased as it offers better performance at an affordable price. Also, witnessed increased acceptance of Hybrid Flash arrays (HFA) as this offers both capacity and performance with a single array.
In Q2 significant spending from banking and telecommunication verticals drove incremental growth in the external storage market. Banking, professional services, telecommunications, manufacturing and government continue to be the key contributors in Q2 2017. Increased acceptance of third platform technologies are pushing organisations to deploy new age storage solutions to address dynamic storage demands. This led revenue touched $70 million in Q2.
High-end storage segment witnessed a high double-digit YoY growth in Q2 2017 due to large deployments from banking and telecommunication verticals. Mid-range storage and entry-level external storage segment saw a marginal de-growth YoY in Q2 2017.
Increased uptake of All Flash Arrays(AFA), Hyper converged infrastructure and Software defined Storage are the key technology trends witnessed in the market. In addition, all the global cloud providers and 3rd party datacenter players are investing heavily to tap the increased uptake of cloud solutions.
However, in Q3, India’s External Storage Market witnessed marginal 0.4 percent growth YoY (by vendor revenue) and stood at $66.4 million in Q3 2017 according to IDC’sQuarterly Enterprise Storage Systems Tracker, Q3 2017. The growth was majorly driven by banking, professional services, manufacturing and government verticals in Q3 2017. Optimization drive for storage infrastructure across organizations stood out to be the leading reason for greater demand for hyper converged infrastructure, software defined storage and cloud technologies. In Q4 the market touched $64 million.
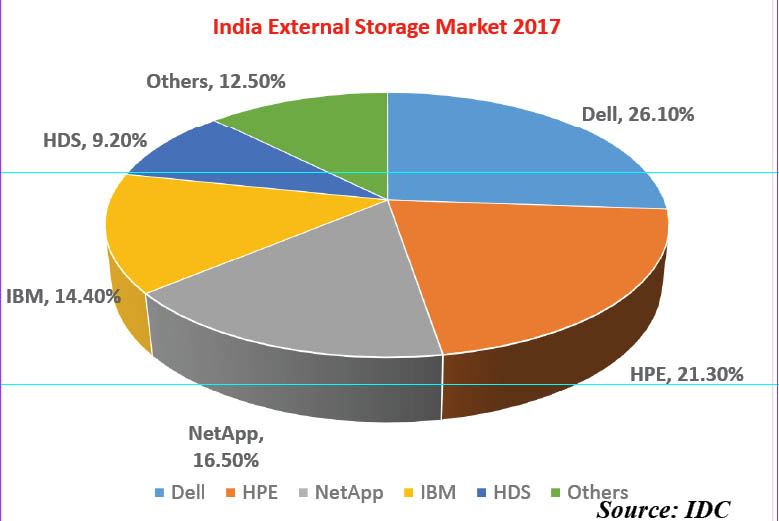
At the end of the fiscal Dell emerged as the market leader with a 26.1 percent market share by vendor revenue, however witnessed a YoY decline in Q3 2017. Hewlett Packard Enterprise gave tough competition to Dell Inc, narrowing the gap in terms of vendor revenue and stood at second position with 21.3%. IBM and HDS witnessed double-digit YoY decline while Huawei and NetApp saw a significant YoY growth in 2017.
The Printer Market in India
With businesses becoming digital, the printer market began to show a steady decline in the last couple of years. However, it was a great year for the overall printer market in India in 2017. Implementation of GST and a sharp cut in the taxation policy drove the market to new heights.
While the Indian HCP (hard copy peripherals) market sold around 3 million printers in 2016, it plummeted to 4 million in 2017 with inkjet printers continue to dominate the demand.
“The growth in the last quarter of the year was driven by GST implementation in the country continuing its momentum from the previous quarter. Government lowered the tax slab on Multi-Function Printers from 28% to 18% effective November 15, leading to increase in preference for MFPs post the slab change. From a YoY perspective, 2017Q4 performed significantly better than the demonetization affected 2016Q4. In the Inkjet market, ink tank printers continue to dominate the market with all the leading vendors focusing on the home and SMB segment to drive the shipments. Laser printer market witnessed a strong growth in the copier segment which saw high demand from BFSI sector, followed by Government,” says Bani Johri, Market Analyst, IPDS, IDC India.
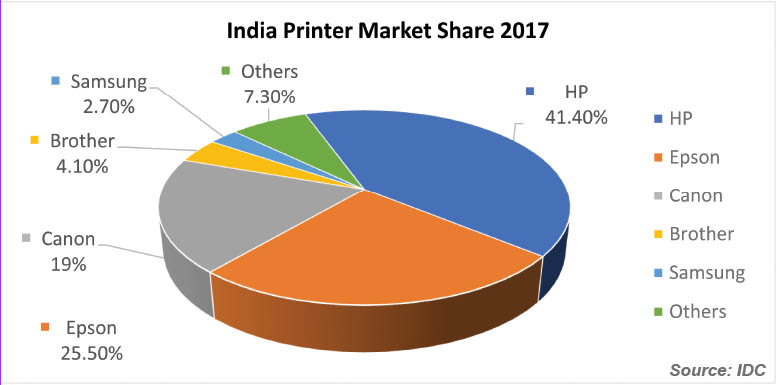 In Q4, 2017, the Indian HCP market saw 877,945 unit shipments, showing a 19% year-on- year growth. Japanese brands have strengthened their position in the Indian market. Three out of top five performers are Japanese companies, capturing almost half of the Indian market (48.6%). US-based brand(s) followed with 41.4% market share, a slight dip from 41.9% in 2017 Q3.
Inkjet shipments grew by 19.3% YoY with overall shipments of 415,135 units while laser printers including copiers also had a similar YoY growth of 19% with overall shipments touching 408,891 units. Indian laser market was the second-best market in the entire Asia- Pacific region, unit wise.
The previous quarter was even more momentous. The HCP market in India had a record high quarter crossing 1.1 million unit shipments in a single quarter. The market grew by 24.2% year-on-year (YoY) and 57.2% quarter-on-quarter (QoQ) growth, as per the latest IDC Asia-Pacific Quarterly Hardcopy Peripherals Tracker, 2017Q3. Inkjet shipments crossed 500,000 units for the first time ever in India with overall shipments touching roughly 579,371 units, a stellar growth of 25.5% YoY, while laser printers market including copiers also had its best quarter since 2014 registering total shipments of 486,947 units with 24.8% YoY growth.
Q3 2017 was anticipated to be better versus Q2 2017 because of the Diwali festive season. Despite a higher tax slab of 28% on multifunction printers, accounting governance created by the Government of India which requires businesses to maintain copies of electronic invoices to claim GST refund, largely contributed to the market growth. Several rounds of online festivals and sales by etailers in the months of August and September also played a part in the robust growth in the consumer demand in the printer category.
HP Inc. remained the overall market leader in HCP with a share of 41.4% and an 11.8% YoY growth. The Laser HCP (Printer-based) market, similar to 2017 Q3, remains dominated by HP with a 54.2% unit market share. It maintained its second position from Q3 in the inkjet market with a market share of 37.6%.
As per IDC India Monthly City-Level Printer Tracker, Laser HCP (Printer-based), demand from West Zone outpaced demand from East and South Zones. HP comfortably leads the way with 15.6% demand coming from West Zone. Delhi was second only to Maharashtra in terms of demand for Laser HCP (Printer-based) printers, overtaking the likes of West Bengal, Rajasthan, Uttar Pradesh, Tamil Nadu, etc.
Epson retained its first position in Inkjet with a unit share of 45.1% and unit shipments, totalling 187,019 units. It also witnessed a 28.3% YoY growth in Inkjet shipments, primarily due to the growth of its M-series models. Epson’s deep channel penetration and focus on the home segment are the key factors contributing to its market leadership in the Inkjet category.
Addition of new channel partners in Mumbai and Pune and deep penetration in smaller cities such as Pune, where demand for ink tank printers outpaced that of some big cities like Chennai and Bangalore also helped them propel to the first spot in the Inkjet market.
Canon too had a good quarter with an overall growth of 25.3% YoY. Laser printers lead the way clocking a YoY growth of 18.8% on the back of a strong push by Canon in the copier market, especially in the colour segment. It retained its number-one position in the copier market with 33.4% unit market share as a result of its strong sales through its direct channel to large enterprises. In the Inkjet market, Canon saw one of the best YoY growth of 36.8% compared to other vendors largely due to strong channel and market push.


Nazara and ONDC set to transform in-game monetization with ‘
Nazara Technologies has teamed up with the Open Network for Digital Comme...

Jio Platforms and NICSI to offer cloud services to government
In a collaborative initiative, the National Informatics Centre Services In...

BSNL awards ₹5,000 Cr Project to RVNL-Led Consortium
A syndicate led by Rail Vikas Nigam Limited (abbreviated as RVNL), along wi...

Pinterest tracks users without consent, alleges complaint
A recent complaint alleges that Pinterest, the popular image-sharing platf...


Netflix adds 'Moments' feature for saving, sharing scenes from
Netflix has introduced a new “Moments” feature on its mobile app, whic

Jacqueline Fernandez come together with YouTuber Mr. Beast for
Jacqueline Fernandez has partnered with American YouTuber Mr. Beast to b

Visa elevates Rishi Chhabra as new Country Manager for India
Rishi holds a Master’s in Industrial Engineering from The Ohio State Univ

Genesys welcomes Albert Nel as Senior VP and Regional Sales Le
Genesys continues to deepen its investment in the APAC region. Earlier this


Bolstering its commitment to help build a truly self-reliant B
CP PLUS is dedicated to spreading a sense of security to every corner of In

Autodesk continually pushing the boundaries in the Design and
Autodesk’s vision is of a better world designed and made for all. It inte

SonicWall Launches TZ80: A Powerful Solution for Remote Office
SonicWall announced today the launch of the TZ80, a groundbreaking securit

Gigabyte X3D Turbo: A Gaming Revolution
GIGABYTE X3D Turbo Mode is a cutting-edge feature that unifies cores distr

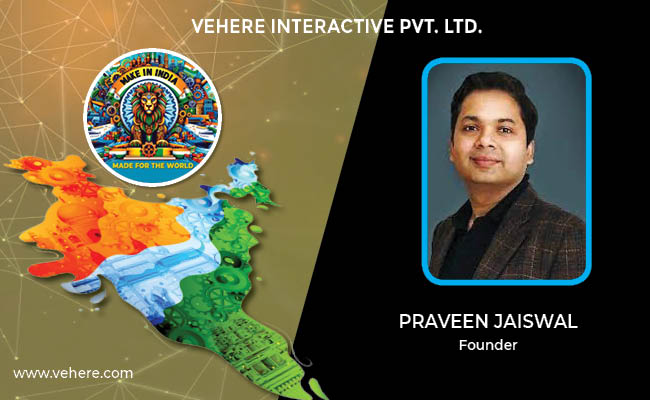
VEHERE INTERACTIVE PVT. LTD.
PRAMA HIKVISION INDIA PRIVATE LIMITED
VVDN TECHNOLOGIES
PDRL - Passenger Drone Research Pvt. Ltd.


ICONS OF INDIA : SHAILENDER KUMAR
Shailender Kumar is senior vice president and regional managing direct...
Icons Of India : Deepak Sharma
Deepak Sharma spearheads Schneider Electric India. He brings with him ...
ICONS OF INDIA : VINAY SINHA
Vinay Sinha is the Managing Director of Sales for the India Mega Regio...


HPCL - Hindustan Petroleum Corporation Ltd.
HPCL is an integrated oil and gas company involved in refining, market...
C-DAC - Centre for Development of Advanced Computing
C-DAC is uniquely positioned in the field of advanced computing...
GSTN - Goods and Services Tax Network
GSTN provides shared IT infrastructure and service to both central and...


Indian Tech Talent Excelling The Tech World - Sundar Pichai, CEO- Alphabet Inc.
Sundar Pichai, the CEO of Google and its parent company Alphabet Inc.,...

Indian Tech Talent Excelling The Tech World - JAY CHAUDHRY, CEO – Zscaler
Jay Chaudhry, an Indian-American technology entrepreneur, is the CEO a...

Indian Tech Talent Excelling The Tech World - Anirudh Devgan , President, Cadence Design
Anirudh Devgan, the Global President and CEO of Cadence Design Systems...